
Macroeconomics: A Complete Guide to Reading the Market for Beginner Investors
Have you ever wondered why the price of groceries suddenly spikes? Or why a single news headline about The Fed or Bank Indonesia can turn your stock and crypto portfolio red overnight?
The answer lies in one word: Macroeconomics.
For many beginner investors, this term sounds intimidating and "heavy." However, understanding macroeconomics is like having a map and a compass while hiking a mountain. Without a map, you might get lost. With a map, you know exactly when to speed up and when to hit the brakes.
Let’s break down these concepts into simple, easy-to-understand language.
What Is Macroeconomics?
Simply put, Macroeconomics is the branch of economics that studies the behavior of the economy as a whole (aggregate).
If we use a forest analogy:
- Microeconomics is when you examine a single tree. its roots, its leaves, and its individual health.
- Macroeconomics is when you look at the entire forest—is it rainy season? Is there a forest fire? Is the soil fertile enough for all the trees to grow?
In the context of a country, macroeconomics doesn't look at the finances of just one company (like looking at Apple or BCA’s financial statements), but rather the economic health of a country or the world globally.
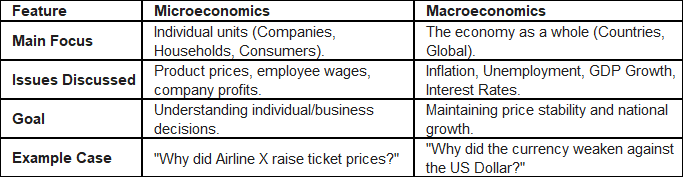
The Basic Difference: Macroeconomics vs Microeconomics
To avoid confusion, let’s look at the key differences in the table below:
3 Key Pillars of Macroeconomics (Indicators You Must Know)
Investors don’t need to be economists, but you absolutely need to monitor these three main indicators. Think of these as your car’s dashboard:
1. Gross Domestic Product (GDP)
This is a country's total score. GDP calculates the total value of all goods and services produced by a country within a specific period.
- If GDP goes up: The economy is "speeding up." Companies are profitable, and jobs are plentiful. This is a good signal to buy stocks.
- If GDP goes down (Recession): The economy is stalling or reversing. People's purchasing power decreases.
2. Inflation
Inflation is the general and continuous increase in the prices of goods and services.
- Mild Inflation: Healthy, indicates demand.
- High Inflation: Dangerous. Your $100 today won't be able to buy the same items next year. This is the number one enemy of cash holders.
3. Unemployment Rate
This shows the percentage of the workforce that is currently jobless. If unemployment is high, the economy is sluggish because people don't have money to spend, which ultimately suppresses company profits.
Economic Policy: The Nation's Brake and Gas Pedals
Who controls the indicators above? There are two main "drivers":
1. Monetary Policy (Central Bank)
This is the tool used by the Central Bank (like The Fed in the US or Bank Indonesia) to control the money supply. Their main tool is the Interest Rate.
- Raising Interest Rates: Done when inflation is too high (the economy is overheating). The goal is to "vacuum" money out of the market so people prefer saving over spending.
- Lowering Interest Rates: Done when the economy is sluggish. The goal is to encourage borrowing (cheap credit) for business expansion and spending.
2. Fiscal Policy (Government)
This is managed by the Government (Ministry of Finance) through the state budget.
- Examples include taxes and subsidies. If the government wants the economy to grow, they might lower taxes or provide social assistance so citizens have more money to spend.
Why is This Important for Investors?
This is the most crucial part. What does all this theory have to do with your investment portfolio?
Everything! Here is the correlation:
- Interest Rates vs. Stocks/Crypto: When Central Banks raise interest rates, the returns on savings and bonds become high and attractive. Big investors (Big Funds) will move their money from risky assets (stocks/crypto) to safe assets (bonds/deposits). The result? Stock and crypto markets usually correct (go down).
- Inflation vs. Purchasing Power: If inflation is high, raw material costs for companies go up. If companies cannot raise their selling prices, their profit margins shrink. Lower profits = Lower stock prices.
- GDP vs. Market Optimism: Positive GDP data releases are often the "fuel" that drives the stock market index up (bullish) because investors are confident that companies will generate large profits.
Conclusion: Don't Fear It, Use It as a Compass!
Learning macroeconomics doesn't mean you have to predict the future perfectly. The goal is for you to manage risk.
If you know interest rates are trending up, maybe it's not the time to go "all-in" with hot money on speculative assets. Conversely, if the economy is starting to recover from a recession (GDP turning positive), this could be a golden moment to start accumulating blue-chip stocks or index funds.
Ready to become a smarter investor? Start by reading light economic news daily, keep an eye on Central Bank rates, and of course, stay consistent with your investments (Dollar Cost Averaging) according to your risk profile!
Disclaimer: This article is for educational purposes only and does not constitute investment advice. Always Do Your Own Research (DYOR) before making any financial decisions.


